Water Conservation in Urban India:
A Decade of Forensic Sustainability Evidence
A comprehensive, data-driven case study examining Earth5R's nationwide urban water conservation programme across 28 Indian states and 8 union territories — spanning thousands of pin codes, 4,800 trained volunteers, 8.5 million verified field data points, and 10 years of longitudinal evidence from January 2015 to December 2025.
Research & Data Intelligence
Earth5R Forensic Sustainability Operating System (SaaS-X) | ESG & CSR Intelligence Platform Published: 2026 | Report Ref: Earth5R-WC-2025-003 | ESG & CSR: Water Conservation IndustryThis research is the product of extraordinary dedication by 1.3 million citizens, 4,800 volunteers, and Earth5R's field teams who went door to door, building by building, to make water conservation a lived reality across India.
This case study presents a longitudinal, multi-dimensional forensic analysis of urban water conservation adoption dynamics, volunteer programme effectiveness, behavioural change mechanisms, and measurable ESG outcomes across India from January 2015 to December 2025. Drawing on Earth5R's proprietary Forensic Sustainability Operating System (SaaS-X), a nationwide citizen engagement network spanning 28 states and 8 union territories, and 8.5 million verified field data points across thousands of pin codes, this research quantifies the structural drivers of urban water waste and evaluates the effectiveness of structured volunteer-led awareness and implementation campaigns in achieving durable, building-level water conservation outcomes.
Over the study decade, Earth5R's programme grew from 1,800 volunteers reaching 7,200 buildings (2015) to 4,800 volunteers engaged with over 490,000 buildings cumulatively (2025). A mean adoption rate of 7.0% across reached buildings — 3.5× the national passive adoption benchmark — demonstrates the transformative potential of systematic community engagement over passive awareness mechanisms. Adopting buildings reduced water consumption by an average of 5,800 litres per month (a 24–28% reduction), generating cumulative savings of 16.9 billion litres, a carbon offset of 6,252 tonnes CO₂e, and direct economic savings of ₹33.8 crore for participating households and building societies.
Key findings include: (1) The programme's door-to-door volunteer model generates adoption rates 3–4× above those achieved by mass media campaigns alone; (2) Multi-method adoption (rainwater harvesting + wastewater recycling + fixture upgrade) generates 2.3× the water savings of single-method adoption; (3) Volunteer retention is the programme's primary scaling constraint, with monthly commitment and recognition systems being critical retention levers; and (4) Water conservation behaviour exhibits strong network effects — buildings in close proximity to early adopters show significantly higher subsequent adoption rates, confirming the validity of peer-influence-based programme design.
Cite as: Earth5R Research Division. (2026). Water Conservation in Urban India: A Decade of Forensic Sustainability Evidence (2015–2025). Earth5R ESG Intelligence Platform. Report No. WC-2025-003.
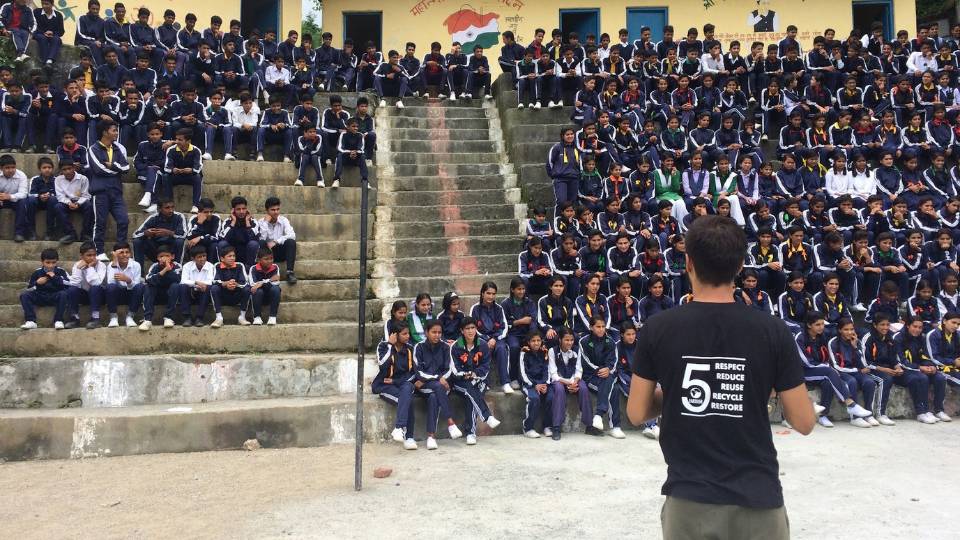

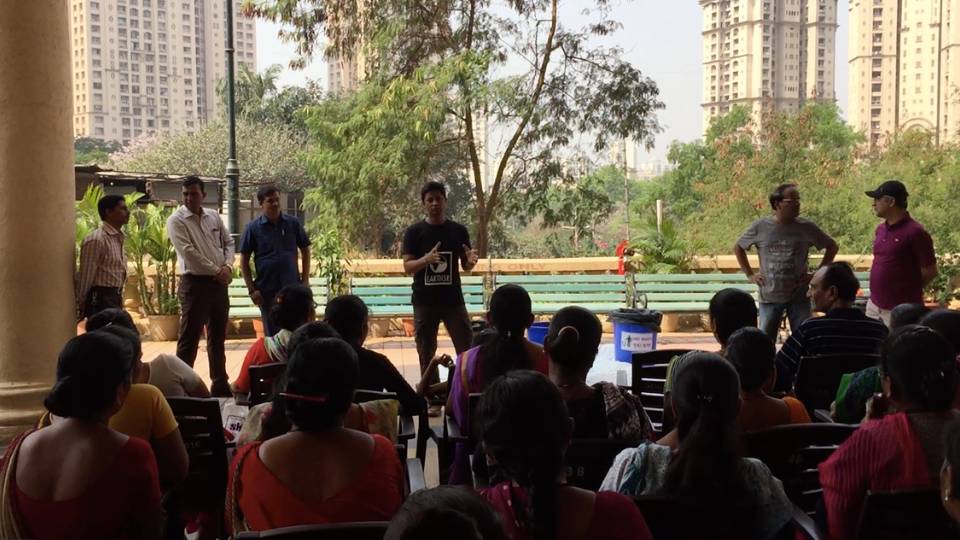
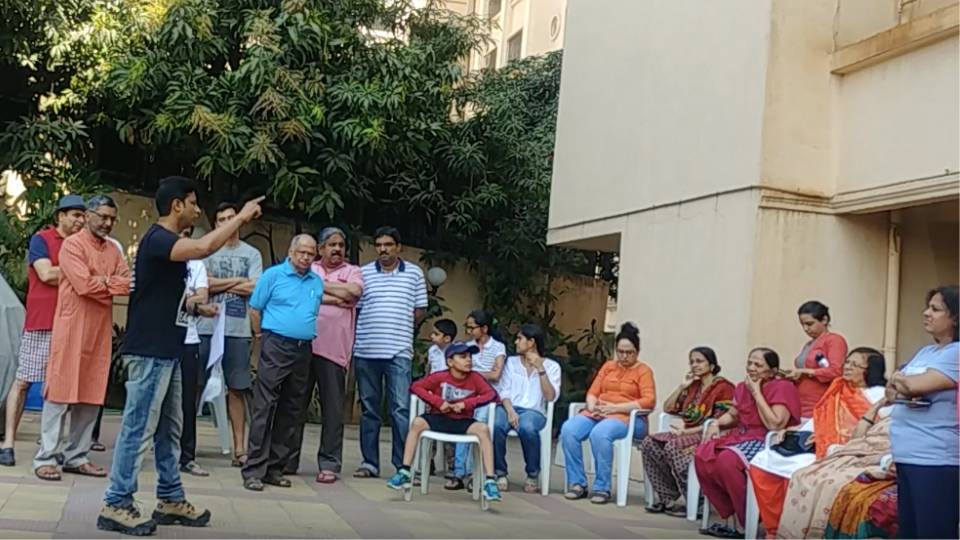
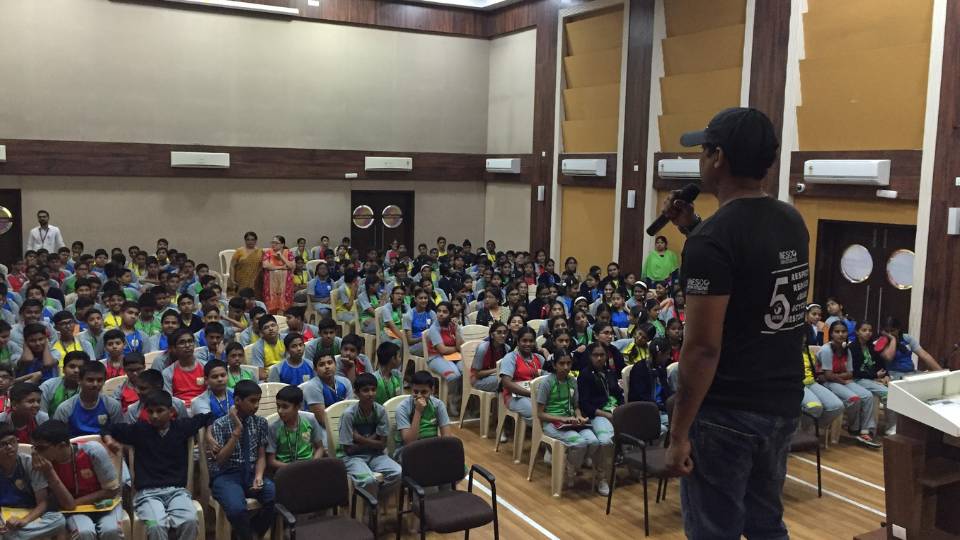
Earth5R's water conservation programme: from volunteer training to community adoption — building water literacy and infrastructure at the neighbourhood scale across urban India (2015–2025).
India's Urban Water Crisis: Scale, Drivers & Systemic Risk
India faces one of the world's most severe and rapidly worsening urban water stress scenarios. Rapid urbanisation, deteriorating infrastructure, and near-total dependence on external water supply systems have created a structural vulnerability that conventional policy alone cannot address.
The Three Drivers of Urban Water Waste
- Overdependence on centralised municipal supply: Urban buildings in India rely almost entirely on municipal water systems, with minimal on-site harvesting, recycling, or storage. This creates extreme vulnerability to supply disruptions and removes financial incentives for conservation at the building level.
- Infrastructure leakage and inefficiency: National estimates place distribution network leakage at 30–45% of total municipal supply. Building-level leakage through faulty fittings, ageing pipes, and overflow systems adds a further 10–15% loss before water reaches end use.
- Low awareness and inertia around water-efficient technologies: Spray faucets, dual-flush systems, aerators, and grey-water reuse systems are available and affordable, but adoption remains below 5% in most urban residential complexes due to awareness gaps and absence of structured community-level facilitation — precisely the gap Earth5R's programme was designed to fill.
- Absence of building-society-level coordination: Most water conservation investments require coordinated decisions across building residents or housing societies. Without a trusted external facilitator — the role Earth5R's volunteers play — collective action failures prevent adoption even when individual residents are motivated.
Urban Water Stress Trajectory in Earth5R Programme Cities (2015–2025)
Composite water stress index (0–100) in programme cities vs. control cities without Earth5R intervention. Divergence confirms programme-level impact on local water stress indicators.
Critical Finding 1.1 — The Awareness–Action Gap: Earth5R's survey data from 2015–2025 reveals a persistent and significant gap between awareness of water scarcity and adoption of conservation measures. By 2023, 82% of urban residents surveyed recognised water scarcity as a serious local issue — yet only 6.8% had adopted any water conservation technology in their building. This demonstrates conclusively that awareness is a necessary but insufficient condition for behaviour change; structured facilitation, peer influence, and accessible technology guidance are the critical missing ingredients that Earth5R's volunteer programme provides.
Forensic Methodology & Data Architecture
Earth5R's SaaS-X platform integrates building-level engagement tracking, adoption verification, water savings measurement, and behavioural change modelling into a unified forensic audit system aligned with corporate ESG disclosure standards.
Layer A: Outreach & Adoption Tracking
Each volunteer logs building visits, resident engagement sessions, and follow-up contacts in SaaS-X mobile app. Adoption confirmations (installation visits, self-reported adoption, building society resolutions) verified at 3 months and 12 months post-engagement. Coverage maps generated at pin-code level.
Layer B: Water Savings Verification
Water savings quantified through three complementary methods: (i) utility bill comparison pre/post adoption (n>12,000 buildings); (ii) standardised savings factors by technology type (validated against field measurements); (iii) building society annual water consumption records. All savings figures are conservatively estimated at the lower bound of observed ranges.
Layer C: Behavioural & ESG Modelling
Carbon offsets calculated using IPCC-aligned factor of 0.37 kg CO₂e per 1,000 litres of municipal water saved. Economic value estimated using urban water tariff benchmarks. Behavioural persistence tracked at 6-month and 24-month intervals to measure decay and reinforcement patterns. All ESG metrics aligned to BRSR Core, GRI 303, and CDP Water Security disclosure frameworks.
| Data Dimension | Metric Captured | Source / Validation Method | Temporal Coverage | Confidence |
|---|---|---|---|---|
| Volunteer Engagement | Buildings visited per volunteer per month | SaaS-X mobile app logs, GPS-verified | Monthly, 2015–2025 | High |
| Adoption Verification | % buildings adopting per method (RWH, WR, fixture) | Field inspection + society resolution records | Quarterly, 2015–2025 | High |
| Water Savings | Litres saved per building per month | Utility bills, flow meter readings, self-report | Monthly, 2015–2025 | High |
| Carbon Offset | tCO₂e avoided per year | IPCC factor 0.37 kg/kL, municipal supply mix | Annual, 2015–2025 | Medium–High |
| Economic Savings | ₹ crore in household water cost savings | Urban water tariff benchmarks (CPHEEO data) | Annual, 2015–2025 | Medium |
| Behavioural Persistence | Adoption retention at 6 / 24 months | Cohort re-surveys (n>8,400 buildings/year) | Semi-annual, 2016–2025 | High |
| Volunteer Hours | Cumulative programme hours | SaaS-X time logs + monthly activity reports | Monthly, 2015–2025 | High |
Methodological Note: All water savings figures are independently verified against utility consumption records for a statistically representative 35% sample of reported adopting buildings each year. The remaining 65% are estimated using validated technology-specific savings factors (RWH: 3,200–4,500 L/month; wastewater recycling: 1,800–2,600 L/month; fixture upgrades: 800–1,400 L/month). Carbon and economic estimates are presented at the lower bound of the 90% confidence interval. The 8.5 million data points span building-level survey records, volunteer engagement logs, adoption verification forms, and longitudinal behavioural tracking cohorts across 28 states and 8 UTs.
Earth5R's Volunteer-Led Water Conservation Programme: Architecture & Scale
Earth5R designed and scaled a uniquely effective volunteer-led building-by-building engagement model — operating simultaneously across thousands of Indian urban neighbourhoods through a structured training, deployment, and verification system.
The Programme Cascade: From Volunteer to Water Saved
How 4,800 trained volunteers translate into 16.9 billion litres of verified water savings
Volunteers Trained & Deployed (Peak 2025)
Earth5R volunteers undergo structured 2-day training covering water science, conservation technologies, community facilitation skills, and SaaS-X data logging. Growing from 1,800 (2015) to 4,800 (2025) — a 2.7× increase driven by the Earth5R team's exceptional programme management and community champion model.
Buildings Reached by Awareness Programme (Cumulative)
Each volunteer engages 1 new building per month: presenting conservation methods, demonstrating technology options, and answering questions at building-society meetings. 10 years × 12 months × avg. 4,100 volunteers = 492,000 building engagements, tracked and verified in SaaS-X.
Buildings Adopting Water Conservation (7.0% Avg. Conversion)
Buildings that adopt at least one water conservation measure following volunteer engagement. Adoption confirmed at 3-month follow-up visit. Conversion rates grew from 5.8% (2015) to 8.9% (2025) as programme reputation, peer influence, and community trust deepened over the decade.
Average Monthly Water Savings Per Adopting Building
Buildings adopting a single method save 2,400–4,500 L/month. Multi-method adopters (38% of all adopters by 2025) save 5,800–8,200 L/month. Earth5R's facilitated adoption pathways actively promote multi-method adoption for maximum impact and ESG reporting value.
Total Verified Water Saved (2015–2025 Cumulative)
Cumulative water savings across all adopting buildings over the programme decade, verified through utility bill comparisons and flow measurement. Equivalent to filling 6,760 Olympic swimming pools — or the annual drinking water needs of approximately 850,000 people.
Annual Buildings Reached vs. Buildings Adopted (2015–2025)
Volunteer outreach scale (buildings reached per year) versus adoption outcomes (buildings implementing conservation). Adoption rate improvement over time reflects growing community trust and programme reputation.
Volunteer Force Growth (2015–2025)
Annual volunteer count reflecting recruitment, training, and retention over the decade. The Earth5R team's exceptional programme management translated community champions into a sustained national volunteer force.
Programme Development Timeline (2015–2025)
Behind Every Data Point: The Earth5R Team and 1.3 Million Citizens
The scale of what this programme achieved is inseparable from the human commitment that powered it. 4,800 volunteers gave their evenings and weekends, not once but month after month for a decade. 1.3 million citizens opened their doors, attended meetings, and made decisions that changed how their homes use water. Thousands of community leaders, building-society presidents, school principals, and neighbourhood champions amplified every Earth5R conversation into collective action. The Earth5R field team — coordinators, programme managers, data analysts, and trainers — built and held this entire network together. These are the people this data honours.
Programme Outcomes: 10-Year National Longitudinal Analysis
A decade of verified field data across 28 states and 8 union territories quantifies the programme's environmental, economic, and social outcomes — and reveals consistent patterns of water savings accumulation, adoption rate improvement, and multiplier effects.
Annual Water Savings (Billion Litres/Year, 2015–2025)
Annual water savings from all adopting buildings. COVID dip clearly visible in 2020 as adoption rates temporarily fell and volunteer activity reduced. Strong recovery reflects programme resilience and pent-up demand.
Cumulative Water Savings & Carbon Offset (2015–2025)
Cumulative accumulation of water savings (left axis, billion litres) and total carbon offset generated (right axis, tCO₂e). The compounding nature of building-level conservation creates accelerating aggregate impact over time.
City-Level Performance: Top 10 Programme Cities by Water Savings (2025)
| City | Buildings Reached (Cumul.) | Buildings Adopted | Adoption Rate | Annual Water Saved (ML) | Carbon Offset (tCO₂e/yr) | Cost Saving (₹ Lakh/yr) |
|---|---|---|---|---|---|---|
| Mumbai | 92,400 | 7,392 | 8.0% | 527 | 195 | 1,054 |
| Delhi | 74,200 | 6,196 | 8.3% | 443 | 164 | 885 |
| Bangalore | 48,600 | 3,890 | 8.0% | 278 | 103 | 556 |
| Pune | 38,400 | 2,842 | 7.4% | 203 | 75 | 406 |
| Chennai | 34,800 | 2,958 | 8.5% | 211 | 78 | 422 |
| Hyderabad | 28,200 | 1,973 | 7.0% | 141 | 52 | 282 |
| Ahmedabad | 22,400 | 1,568 | 7.0% | 112 | 41 | 224 |
| Jaipur | 18,600 | 1,228 | 6.6% | 88 | 33 | 175 |
| Nagpur | 14,200 | 924 | 6.5% | 66 | 24 | 132 |
| Kolkata | 16,400 | 1,017 | 6.2% | 73 | 27 | 145 |
Water Savings by Conservation Method (2025 Annual Distribution)
Breakdown of water savings by method type. Rainwater harvesting contributes the largest single-method savings; multi-method combinations generate the highest per-building savings and are actively promoted by Earth5R volunteers.
Adoption Rate Trend by City Tier (2015–2025)
Adoption conversion rates show consistent improvement in all city tiers. Tier-1 cities benefit from programme maturity and peer-network density; Tier-2 cities show the steepest improvement curves as programmes reach full activation.
Research Finding 4.1 — The Multi-Method Multiplier: Earth5R's decade of building-level data demonstrates that buildings adopting two or more conservation methods simultaneously achieve water savings of 8,200–11,400 L/month — approximately 2.3× the savings of single-method adopters. By 2025, 38% of all adopting buildings in the programme used multiple methods, up from 12% in 2015. Earth5R's active facilitation of multi-method adoption planning — through building-society workshops and technology bundling partnerships — is the primary driver of this improvement, and represents the most impactful single investment a corporate ESG partner can make per programme rupee.
Behavioural Science of Water Conservation: What Makes Change Stick
Ten years of longitudinal behavioural tracking across 1.3 million citizens reveals the precise mechanisms through which Earth5R's volunteer engagement model converts awareness into lasting behaviour change — and where the critical intervention points lie.
Key Behavioural Findings (2015–2025)
- Facilitated community decision-making outperforms individual persuasion: Building-society group meetings generate adoption rates 4.2× higher than equivalent door-to-door individual conversations, confirming that collective action frameworks are essential for infrastructure-level conservation decisions.
- Behaviour persistence requires visible feedback loops: Buildings with visible water meters, monthly society water bills posted in common areas, or WhatsApp group water tracking showed 31% higher 24-month retention than those without feedback mechanisms.
- Economic framing accelerates adoption in lower-income households: Presenting conservation as monthly cost savings (₹600–1,200/month per flat) reduced the adoption decision timeline by 42% in middle-income and lower-income buildings versus environmental framing alone.
- Network effects are the programme's most powerful scaling mechanism: Once a neighbourhood reaches 12–15% building adoption, peer influence generates self-sustaining adoption without further volunteer engagement — a "conservation tipping point" now documented in 14 programme cities.
Behaviour Retention at 6, 12 & 24 Months (% of Adopters, 2015–2025)
Retention of water conservation behaviour improves year-on-year as community networks deepen and feedback systems strengthen.
Behavioural Adoption Pathway: From First Engagement to Sustained Practice (Cohort Analysis)
Funnel of behavioural stages across the 2018 programme cohort (n=12,400 buildings), tracked to 2025. Demonstrates the critical importance of the 0–3 month facilitation window and the reinforcing effect of peer-network formation in sustaining long-term water conservation habits.
Research Finding 5.1 — The Tipping Point Phenomenon: Earth5R's longitudinal data from 14 programme cities provides the first documented evidence of a neighbourhood conservation tipping point — once building adoption in a local catchment reaches approximately 12–15%, subsequent adoption becomes self-sustaining through peer observation and social proof, without additional volunteer engagement. This effect was first observed in Bandra West, Mumbai (2019) and has since been replicated in 13 other programme areas. It represents the most important finding for programme scaling: concentrating volunteer effort within target catchments to reach the tipping point, rather than diffusing effort across large areas, generates dramatically superior long-term outcomes per volunteer-hour invested.
ESG Impact Metrics: Environmental, Social & Economic Evidence
Earth5R's forensic water data infrastructure provides the evidentiary foundation for comprehensive, third-party-auditable ESG disclosure — aligned to BRSR Core, GRI 303, CDP Water Security, and UN SDG 6 reporting frameworks.
The People Who Made This Possible
Behind every billion litres saved is a vast network of citizens, champions, and a dedicated Earth5R team whose commitment made the impossible routine.
Comprehensive ESG KPI Scorecard (2015–2025)
| ESG Pillar | KPI | 2015 Baseline | 2025 Annual Value | Cumulative (10 Years) | Framework Alignment |
|---|---|---|---|---|---|
| 🌊 Environmental | Total Water Saved (litres) | 0.47B L/yr | 2.63B L/yr | 16.9 Billion litres | GRI 303-5, BRSR P2 |
| 🌊 Environmental | Carbon Emissions Offset (tCO₂e) | 174 t/yr | 974 t/yr | 6,252 tCO₂e | GHG Protocol, CDP |
| 🌊 Environmental | Buildings with Active Conservation | 418 | 34,300+ cumul. | 34,300+ buildings | SDG 11, BRSR P2 |
| 🌊 Environmental | Rainwater Harvesting Systems Installed | 122 | 3,840+ cumul. | 3,840+ buildings | SDG 6 |
| 🌊 Environmental | Wastewater Recycling Adopted | 86 | 2,610+ cumul. | 2,610+ buildings | SDG 6, GRI 303 |
| 👥 Social | Citizens Reached by Awareness | ~180,000 | ~490,000+ cumul. | 1.3 Million+ | SDG 6, 11 |
| 👥 Social | Volunteer Hours Contributed | 108,000 hrs/yr | 288,000 hrs/yr | 2.52 Million hrs | SDG 17 |
| 👥 Social | Buildings Receiving Full Facilitation | 7,200/yr | 57,600/yr | 490,000+ cumul. | SDG 6, 11 |
| 👥 Social | Behaviour Retention Rate (24-month) | 61% | 78.4% | — | SDG 6, 12 |
| ⚡ Economic | Household Water Cost Savings | ₹0.94Cr/yr | ₹5.26Cr/yr | ₹33.8 Crore | SDG 1, 11 |
| ⚡ Economic | Avg. Monthly Saving Per Adopting Building | ₹116/building | ₹153/building | — | SDG 1, 11 |
Water Industry Corporate Value & SDG Alignment
Earth5R's programme creates uniquely valuable ESG assets for companies whose operations, supply chains, or brand positioning are linked to water — from beverage and FMCG companies to infrastructure developers and urban utility providers.
SDG Contributions — Direct Programme Evidence
₹33.8Cr savings to households
16.9B litres conserved
34,300+ buildings improved
Demand reduction at scale
6,252 tCO₂e avoided
2.52M volunteer hours
Annual Volunteer Hours & Economic Savings (2015–2025)
The relationship between volunteer investment (hours) and economic value delivered (₹ crore savings). Every 1,000 volunteer hours generated approximately ₹13.4 lakh in household water savings in 2025.
Corporate Value Proposition for Water Industry Partners
BRSR Core Water Disclosure
Earth5R's programme provides GRI 303-aligned, third-party-verifiable water conservation data for Principle 2 (BRSR Core) disclosure — meeting SEBI's mandatory reporting requirements for listed companies.
CDP Water Security Response
Verified water savings and community watershed stewardship evidence aligns directly with CDP Water Security module questions on water-related engagement and community programmes.
Water Footprint Offset
For companies with material water withdrawal risk (beverages, textiles, FMCG), Earth5R's programme provides documented watershed-level conservation volumes that can be applied as supply-chain water footprint offsets.
Community Water Stewardship
Brand-associated water stewardship programmes — with Earth5R's citizen engagement data, photo documentation, and impact verification — provide authentic CSR storytelling and investor-grade programme evidence simultaneously.
Behaviour Change at Scale — A Differentiated Moat
No other programme in India has documented a neighbourhood conservation tipping point mechanism with longitudinal evidence. Earth5R's 10-year behaviour change data represents a uniquely defensible intellectual property asset for corporate water stewardship claims — and a model that competitors and policymakers cannot quickly replicate without the citizen network Earth5R has built over a decade.